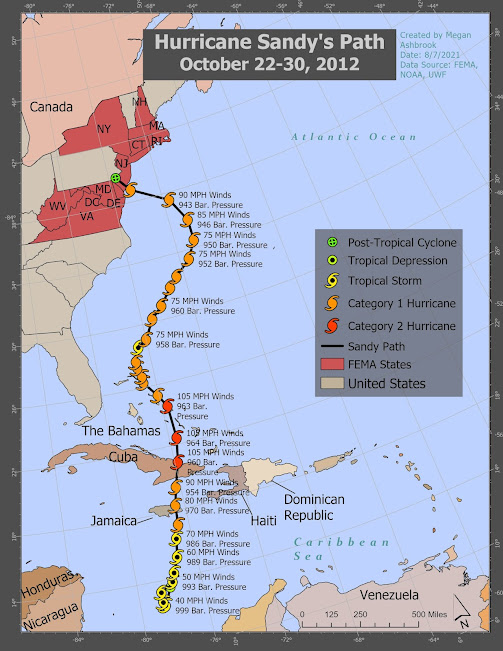
This week's module built on the topic of last week's. It covered coastal damage from actual events such as storm surge. In the lab, I worked with data for Hurricane Sandy in 2012. In the first part of the lab, I tracked the path of Sandy in ArcPro. I created a map that displayed its path and learned to symbolize the points with hurricane symbology. The final task of this section was to make a map of Sandy's track. I used a lot of my skills from other classes to make this map.
In the second part of the lab, I created an online ArcGIS survey for the "public" to report damage. I did not know ESRI had this feature.The third and final part of the lab was to compare pre and post Sandy imagery and catalog a section of structure damage. In the damage assessment feature class, I made domains for each field. This was extremely useful. It saved a lot of time on the actual image assessment. I wish I had known about this for other classes.
I cataloged each structure in the study area with structure damage, wind damage, inundation, and structure type. I worked
around each block and assigned a point with damage attributes to each structure
at 1:1,118 scale. I used the swipe feature to compare the differences between
the two photos. I found the Active Template in the Create Features pane the
best option to enter attributes. This was much easier for me than the attribute
table. I assigned every structure in this study area as inundated. This is
because there was sand covering the roads everywhere. The most challenging
attribute was the wind damage. I assigned this when it looked like part of the
roof was gone or the building was destroyed. Below is a screenshot of my points and part of the attribute table.
Within 100m
from the coast 30% of buildings are affected, 20% are majorly damaged, 50% are
destroyed. Within 100-200m of the coast, 2% of buildings are affected, 23% are minorly
damaged, 61% are majorly damaged, and 14% are destroyed. Within 200-300m 40% of
buildings are affected and 60% are minorly damaged. Based on these findings,
distance to the coast affects structural damage. The closer to the coast the
greater the damage to a structure. In scenarios similar to this, it is reliable
enough to extrapolate to nearby areas to determine probable building damage
levels.


Comments
Post a Comment